Thursday, July 29, 2010

Day 4 Nano Institute


Becky started the morning with a discussion about what graduate students do. Michael and Vicky shared their unique perspective but overall I marveled at how dedicated they are to their education.

Becky moved into teaching about scanning tunnel microscopy (STM). The basis in STM is that electrons have wavelength properties. It's the wavelike property of that allows them to tunnel. There is a probability that an electron can penetrate a barrier without the required amount of energy. The measurement is actually the measure of the amount of electrons that jump from surface to tip. There are two modes for STM, constant height mode and constant current mode. In constant height mode the tip stays at the same height . The problem with this is that the tip might crash into an obstruction. Most of the time constant current mode is used. In constant current the tip moves when it comes to an obstruction.

According to Becky you must be clever when interpreting STM data. STM maps out information about electron density of the surface-you are not actually looking at the topography, Your data is how much the tip moves up and down. STM can also be used to move atoms around. Becky showed two examples of atoms that had been moved.

The program continued with Lynda presenting her summer research. This was followed by the presentation of work being done by local high school students. At the start of the afternoon Becky presented the project that she is working on. The remainder of the day was spent working on our reflections and symposium presentations.

Wednesday, July 28, 2010

Day 3 Nano Institute

The focus for today was atomic force microscopes (AFMs). Val reminded us that when we use AFMs we are "seeing" the surface without really seeing it. It is a sensory experience. A good reminder of that was given through the "Braille Game." The essence of this game was to determine what braille letters were punched into the cardboard without looking at it, so we kept them from view under the table while determining what letter was represented.
Similarly, AFM works by tapping along the surface and reading it, rather than looking at the surface with light. AFM gives only a surface image, it does not give color. AFMs can be operated in different modes; contact mode, in which the tip is in constant contact with the surface of the sample, and tapping mode which is used for soft samples such as cells and DNA. Val also advised us of the concerns that may come up with imaging; moving the tip too fast or too slow, the distance between the sample and the tip, and the tip itself. Images were shared showing some of these concerns. The morning continued on with completion of an analogous grid activity where we had to tap a probe along a surface, map it, build a 3-D model, draw the negative spaces of that 3-D model (which I just realized I did incorrectly looking at the picture). Then we made an Excel surface plot and changed the angle of that plot.


Val also discussed her current research, asking frequent questions of us along the way. This helped to keep me engaged in her lecture, as I attempted to put what I've been learning to work.

Following all of this, each of us was able to operate the AFM with Val sitting beside us! It was exciting but frightening at the same time! I am thrilled that my students will have the oportunity to see the AFM when they bring it to school as part of the nano program!

The afternoon was spent in pedagogy discussing issues we may have implementing this nano program in our classrooms and with science education in general. Commenting on that discussion, at HFS we do not have any dedicated space for science and I frequently feel limited by available materials. I would love to have a source to borrow materials as well as guidance in establishing a science club.

Tuesday, July 27, 2010

Day 2 Nano Institute


A good part of the morning was spent learning about optics. We made the same telescopes as were made last week and tested them to see their abilities but then we turned them into microscopes! We did this by taking the tubes apart and then taking the larger tube (with larger lens) and putting the a hand lens on the bottom of the tube (the same side as the lens). So cool...who'd a thought!

We also learned more about scanning electron microscopes (SEMs). In an SEM a beam of electrons are sent down into an object. Some of the electrons are reflected, some are absorbed. The electrons are collected from data points revealing the image. The feature size can reveal details down to 1nm. Magnification to 500,000x that of a light microscope.

We "played" with digital microscopes, looking at things like dandelion seeds, ribbon, ink... pretty much whatever we wanted to look at. We each received a digital microscope for our classrooms! I love the idea that I not only will be able to project the image onto a computer screen but also onto a whiteboard. You can also do screen capture! Classroom applications abound (as do exclamation points)!

We then played, "What's that Gunk?" Where we identified SEM images. At the end of the morning we went to see the SEM that we will be able to borrow for use in our classrooms. Sharon demonstrated it by looking at the image of a dime. I find the idea of using it to be intimidating, so I hope there will be hands-on training available before placing it in our rooms.

The afternoon was spent touring the research facilty at Stinson-Remick Hall. We able to see the cleanroom and learn how it works. We also were able to check out various laboratories housed in the same building. On our way back to Jordan Hall we visited Becky's lab. We'll learn more about her work later this week.

Monday, July 26, 2010

Day 1 Nano Institute for Teachers


What a great start to the NANO K-6 Summer Institute! Becky, Mike and Val are terrific at getting essential information across to those, like me, are virtually uninitiated to nanotechnology. We did scale projects where we had to place items where we believed they belonged on a number line by length and then by mass. Those items I am familiar with weren't difficult but those that were very small like viruses and blood cells or very large like the Earth and the sun were a different story! This would be a great activity to do with students. Perhaps begin with those things they are familiar with and then add in microscopic items like blood cells, bacteria and viruses after they've been studied. At a later time in the morning we watched "The Powers of Ten" video.

Mystery boxes were a great way to introduce what we can learn through the use of touch. We then learned about different kinds of microscopes used in studying items at the nanoscale:
scanning tunnel microscope (STM)-tip scans along and maps out surface
scanning electron microscope (SEM)-a beam of electrons scans a sample, the electrons actually go into the sample, and the topography is mapped out
atomic force microscope (ATF)- through tapping the surface with a cantilever, height variations are measured

I loved the discussion on the potential impact of nanotechnology: nano solar cells mixed in plastic and painted on objects, materials that resist stain, paint that doesn't chip, paint that reduces pollution, dvds that could hold a million movies. The implications in the medical field are the most fascinating for me: nerve tissue talking to computers, quantum dots injected to detect disease earlier, growing tissue to repair heart muscle, nanocoatings to prevent viruses. The potential for making repairs to the body is amazing!

This is the video we watched introducing us to nanotechnology:

Friday, July 23, 2010

Day 5 Astro Institute


The CLEA lab was canceled today so the day began with Shelly's lecture on 'H-R Diagram of the Stars and Stellar Evolution.' There are three ways to determine where a star is on an H-R diagram:

absolute magnitude and spectral class
apparent magnitude can be used, but then it won't be standardized
scientists use luminosity (rate of energy being given off by a star) and temperature

Some ideas pulled from Shelly's lecture:

white dwarfs are hot but small, so they appear not so bright
the sun is on the main sequence
giants are huge, they give off a lot of energy but are considered cool
super giants are huge
a main sequence star is burning hydrogen to helium
stars spend 90% of their time in the main sequence
all stars go through lifecycles

Earth was a star 13 billion years ago. It exploded and made the solar system and other stars. It was a supernova. That is known because it has elements higher than iron.

Black holes, if they are sucking in things, suck in things that are close by. It is gravity that does the sucking. The holes absorb a lot of energy. The inside of a black hole is very dense. A grain of sand could weigh as much as a solar system.

Shelly's lecture was interesting and packed with information. There was so much information that, try as I might, I couldn't keep up.

After lunch the teachers were summed up the week in a symposium prepared in advance. We were asked to speak about the things that we learned that surprised us, the tools we honestly felt we would use in our classrooms and those we didn't feel we would use at all. We also talked about the impact of the various activities from the week. Group presentations followed based on how we would use what we learned in our classrooms based on the state standards. The week closed with the distribution of certificates.

Thursday, July 22, 2010

Day 4 Astro Institute


We began our learning day with another CLEA lab, "Classification of Stellar Spectra." The idea behind this lab was to be use what we know (data) to classify what we don't know. We used known spectra of main sequence stars and compared them the spectra of unknown stars. I found the mnemonic 'Oh BE A Fine Girl, Kiss Me,' (OBAFGKM) to be very helpful in identifying the age and temperature of stars. The order goes from hot to cold, young to old. We determined the elements of the star by using absorption lines for further refinement of the classification. We also learned that it is possible to use the spectra of the star to identify it. I understood much of the concept of what we were doing but the actual doing was another story!

Following a short break Caroline gave a lecture, "Stellar Spectra in the Classroom." I have so many notes from this lecture! Spectroscopy breaks light into different wavelengths (different colors). These make up the visible spectrum of colors, red, orange, yellow, green, blue, indigo, violet (roygbiv). She spoke about where visible light fits in the electromagnetic spectrum, the progression of long wavelengths (radiowaves) to short (gamma rays) and the effect of those waves on humans. Caroline gave us a historical background beginning with the contributions of Joseph Frauenhofer, Annie Jump Cannon, and Cecilia Payne. It was nice to get this human element in the midst of so much factual information!

Caroline then gave a description of fusion and fission that will help me keep them straight. She told us fusion, which takes place in stars, takes parts and makes a whole. Specifically she said nature puts together, humans take apart.

Spectral lines form in the photosphere, an outer, cooler layer of the star. She then led us through continuum (continuous), emission (forms bright lines) and absorption (forms dark lines) spectra. Finally Caroline talked about rainbows which reflect and refract light. She also explained why the colors are always in the same order. Something I need to review on my own!

The lecture then went on to reinforce the material from the morning lab. The appearance of the spectra of a star is dependent on the temperature of the star:

Classes OBAFGKM; Color progression blue-->red; temperature progression hot-->cold.

How can you tell if a star is moving? By it's shift! A redshift star would emit a longer wavelength and would be moving away. A blue/violetshift star would be moving closer.

Wow! What a morning! Thank goodness for lunch and a chance to decompress!

In the afternoon we made spectroscopes and used them to color the patterns and identify the emission patterns we found in the spectra of a regular light bulb, flourescent light, argon, and helium. NDeRC gave us several spectrometers to take back to our classrooms.

For the final activity of the day we used Oreo cookies to model moon phases by opening the cookies and scraping off the frosting. We then put the cookies in correct postion in relation to the Earth and Sun. Remember, waxing on, waning off! This is a fun elementary lab available online.

Wednesday, July 21, 2010

Day 3 Astro Institute

Today began with a CLEA (Contemporary Laboratory Experiences in Astronomy) lab. The purpose of the lab was to study how photons travel from the Sun's core and how they interact with other matter on their way into space. We set parameters for simulations and collected data. CLEA was designed for use in high school and college classes and, while I was able to complete the lab, I didn't thoroughly understand the underlying concepts.

Following the CLEA lab and a break Tom introduced us to solar weather. Some facts gleaned from his lecture:
  • the Sun is the source for space weather

  • UV from the Sun produces Earth's ozone layer

  • charged particles flowing outward from the Sun form solar winds

  • CMEs (coronal mass ejections) and solar flares spew fountains of high energy plasma into the solar environment

  • CMEs are not as strong as solar flares

We watched a video, "NASA Warns of Super Solar Storm," about a predicted solar storm and it's effect on the Earth. We were asked to evaluate the credentials of the scientist, Michio Kaku. A good reminder for us and for our students to critically evaluate information.


The lecture continued to Earth's magnetic field:

  • the magnetic field is weakening

  • it flips about every 30,000 years
  • next flip predicted in the next 1,000 years

  • it protects us from solar flares

  • auroras are photons from solar flares entering along Earth's magnetic lines

Tom then put the parts together with the conclusion that the effects of a major solar storm could disrupt communication, take down power grids... A major storm is predicted within the next few years!

A break for lunch was followed by a quick review of metric conversions. We were then split into two groups to make a scale model of the solar system. This was done with each teacher representing a planet and then measuring off the distance between the planets. The activity didn't end there! We then had to send an electromagnetic message (light) from our Sun to our dwarf planet (Pluto) and then back to the Sun demonstrating that it takes time for light to travel. It takes 9 years for the light from the star Sirius to reach the Earth!


Before we returned to the classroom we stopped at the sundial in front of Jordan Hall for a lesson on sundials.

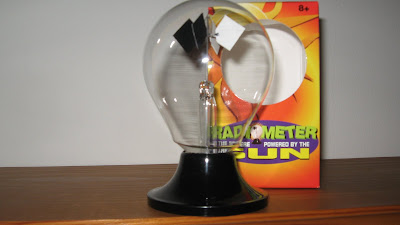
Back inside the classroom we learned about astronomical units followed by radiometers. The vanes of the radiometers reflect (white) or absorb (black) the Sun's photons. This transfer of energy causes the vanes to spin. The stronger the light the faster the radiometer spins.

At the end of the afternoon each teacher was given a set of planet pictures and a radiometer for their classroom. Thanks NDeRC!